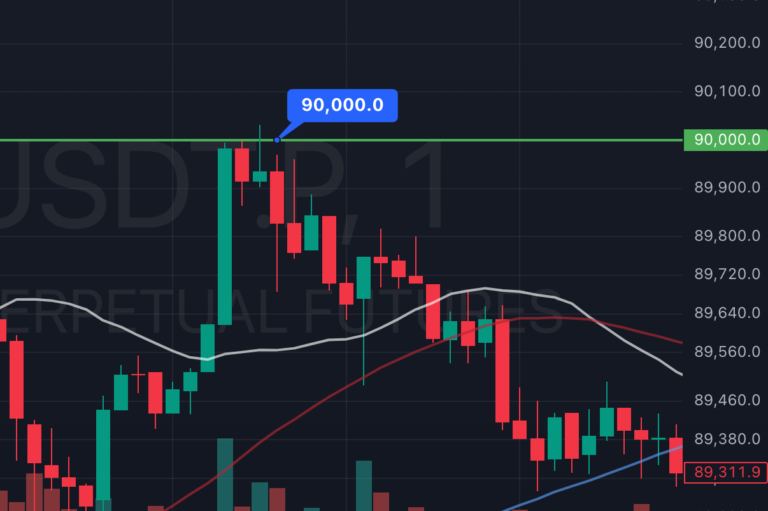
Yesterday’s Bitcoin surge to $90,000 (some charts did not even reach it) signals a powerful movement upwards, especially as it aligns with the 2024 U.S. election results on November 5th. This new rally appears to be fueled by renewed market sentiment and strategic moves within the crypto industry, signaling a potential shift in Bitcoin’s trajectory.

The Influence of Trump’s Pro-Crypto Stance
Donald Trump’s presidency is proving to be a significant influence on Bitcoin’s latest rally, largely due to his endorsement of cryptocurrency and the launch of his own project, World Liberty Finance (WLF), a decentralized finance (DeFi) platform that debuted in September 2024. Despite mixed reactions toward WLF, its impact on the market is undeniable. By spotlighting crypto on a mainstream political platform, Trump has helped drive interest and optimism in the space, particularly among institutional investors who may view this endorsement as a step toward wider regulatory acceptance.
A Pattern of Historical Surges
To understand this rise, it’s worth looking back at Bitcoin’s historical trends:
- May 2019: After a prolonged “crypto winter,” Bitcoin broke above $5.8K and surged to $13K, marking a key period of recovery.
- October 2020: BTC’s rally from $10.6K to $41K by January 2021 and an eventual high of $64K in April 2021 set the stage for widespread retail and institutional adoption.
- November 2021: Bitcoin hit an all-time high of $69K, though BTC dominance dipped into the low 40% range, signaling more diverse investments in altcoins.
These milestones reveal that Bitcoin thrives on a cyclical uptrend punctuated by periods of intense accumulation and profit-taking. The recent surge, beginning from a double bottom pattern around November 2022, suggests that Bitcoin is once again in a bullish phase, potentially fueled by favorable macroeconomic factors and increased market sentiment.
Total Market Cap and Bull Run Indicators
Bitcoin’s dominance (btc.d) has steadily climbed back, supported by strong fundamentals and widespread interest. This resurgence aligns with an increase in the total market cap, which currently sits at approximately $2.905 trillion. Given that the last all-time high in November 2021 saw a market cap of $3 trillion, this metric alone indicates the current upward momentum, hinting at Bitcoin’s potential to break previous highs.

The Importance of Volume and RSI Levels
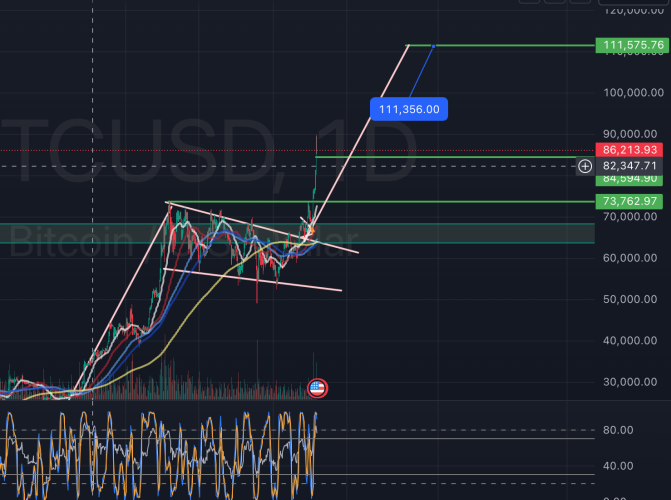
Volume has shown resilience since Bitcoin surpassed $71K, but caution is necessary. A high stochastic RSI on the daily chart, coupled with the 4-hour stochastics curving downward, suggests the possibility of a cooldown. The RSI is also reaching overbought levels on both daily and 4-hour charts. These indicators imply that a period of consolidation could be imminent, possibly manifesting as a flag or ascending triangle pattern. If these technical structures form and hold, they could set the stage for an eventual push toward a new high—possibly as far as $110K within the year.
What Lies Ahead?
The trajectory toward $110K, as indicated by broader weekly patterns, would require ongoing momentum and resilience across global markets. As adoption continues to grow and new players enter the DeFi space, Bitcoin’s role as a digital store of value may strengthen, especially if Trump’s WLF project generates ongoing interest in decentralized finance.
While a short-term cooldown may be in order, the technical indicators and historical data point to a resilient upward trend for Bitcoin, with significant potential for continued growth in both price and market influence. If Bitcoin continues on this path, it could redefine market expectations and solidify its role in the broader financial landscape.
Disclaimer: This article is for informational purposes only and should not be considered financial advice. Always do your own research or consult with a financial professional before making any investment decisions.

